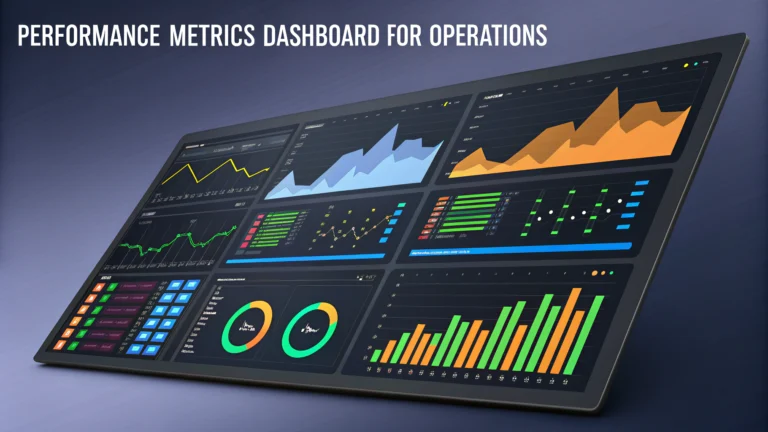
Performance metrics dashboards help COOs track, analyze, and optimize operational efficiency across their organization.
A well-designed dashboard combines real-time data visualization with actionable insights, enabling quick decision-making and performance improvements.
This guide outlines the key components and best practices for creating effective operational performance dashboards.
Essential KPIs for Operations Dashboards
- Productivity Metrics
- Output per employee
- Resource utilization rates
- Labor efficiency ratio
- Quality Indicators
- Defect rates
- Customer satisfaction scores
- First-pass yield
- Financial Metrics
- Operating costs
- Revenue per employee
- Cost per unit
Dashboard Design Best Practices
Organize metrics by department or function to maintain clear visual hierarchy.
Use color coding consistently to highlight performance status (green for on-target, yellow for caution, red for issues).
Include trend indicators to show performance direction over time.
| View Type | Time Frame | Use Case |
|---|---|---|
| Strategic | Monthly/Quarterly | Long-term planning |
| Tactical | Weekly | Department management |
| Operational | Daily/Real-time | Immediate action |
Data Integration and Updates
Connect dashboard systems with existing ERP, CRM, and other operational databases for real-time updates.
- Recommended Data Sources:
- SAP ERP
- Oracle NetSuite
- Salesforce
- Microsoft Dynamics 365
Dashboard Software Solutions
Select dashboard software based on your organization’s size, complexity, and integration needs.
- Enterprise Solutions:
- Tableau (www.tableau.com)
- Power BI (powerbi.microsoft.com)
- Qlik Sense (www.qlik.com)
Implementation Tips
- Start with a pilot program in one department before full rollout
- Train users on dashboard interpretation and usage
- Establish clear update schedules and data validation processes
- Create feedback channels for continuous improvement
Making Data-Driven Decisions
Set up automated alerts for metrics that fall outside predetermined thresholds.
Schedule regular performance review meetings focused on dashboard insights.
Document action items and track their impact on performance metrics.
Moving Forward with Performance Management
Review and update dashboard metrics quarterly to ensure alignment with business objectives.
Consider consulting with dashboard implementation specialists for complex setups (Gartner’s BI Platform Reviews).
Performance Analysis and Optimization
Regularly analyze dashboard data to identify performance gaps and optimization opportunities.
Create action plans based on trending data and predictive analytics insights.
- Analysis Best Practices:
- Compare performance across similar departments
- Identify seasonal patterns and adjustments
- Track improvement initiatives impact
Stakeholder Communication
Develop targeted dashboard views for different stakeholder groups.
- Key Stakeholder Requirements:
- Executive summaries for C-level
- Detailed operational views for managers
- Team-specific metrics for supervisors
Security and Compliance
Implement role-based access controls and data governance policies.
- Security Measures:
- Data encryption standards
- Audit trails for dashboard access
- Compliance reporting capabilities
Maximizing Dashboard Impact for Operational Excellence
Regular dashboard maintenance and evolution ensure continued relevance and effectiveness in driving operational improvements.
- Long-term Success Factors:
- Continuous user feedback integration
- Regular metric refinement
- Technology updates and enhancements
Leverage dashboard insights to create a data-driven culture that promotes continuous improvement and operational excellence.
FAQs
- What are the key metrics that should be included in a COO’s performance dashboard?
Key metrics should include operational efficiency (OEE), productivity rates, quality metrics, cost per unit, inventory turnover, customer satisfaction scores (CSAT), employee turnover rate, safety incidents, and capacity utilization. - How frequently should a performance metrics dashboard be updated?
Performance dashboards should be updated in real-time where possible, with daily updates at minimum for critical metrics. Strategic KPIs can be updated weekly or monthly depending on the business cycle. - What visualization tools are most effective for operations dashboards?
Effective visualization tools include trend lines, bar charts for comparisons, gauge charts for targets, heat maps for problem areas, and sparklines for quick performance snapshots. Tools like Tableau, Power BI, or QlikView are commonly used. - How can a COO ensure dashboard metrics align with strategic objectives?
Metrics should be derived from organizational strategic goals, using cascading KPIs that link operational performance to business outcomes, with regular reviews to ensure continued alignment. - What are the best practices for setting performance targets in operations dashboards?
Targets should be SMART (Specific, Measurable, Achievable, Relevant, Time-bound), based on historical performance, industry benchmarks, and strategic goals, with both short-term and long-term objectives. - How can a dashboard effectively track supply chain performance?
Supply chain metrics should include supplier delivery performance, lead times, inventory levels, order accuracy, transportation costs, and on-time delivery rates to customers. - What financial metrics should be included in an operations dashboard?
Key financial metrics include operating costs, labor costs, material costs, overhead allocation, working capital metrics, and variance analysis comparing actual vs. budgeted performance. - How can quality control be effectively monitored through a dashboard?
Quality metrics should include defect rates, first-pass yield, customer complaints, returns rate, compliance rates, and process capability indices (Cpk). - What workforce metrics are essential for operations monitoring?
Essential workforce metrics include labor productivity, overtime usage, absenteeism rates, training completion rates, safety incidents, and employee satisfaction scores. - How should sustainability and environmental metrics be incorporated?
Include metrics for energy consumption, waste reduction, carbon emissions, water usage, recycling rates, and compliance with environmental regulations.